Article
More Socially Vulnerable Areas in the US Associated With Higher Liver-Related Mortality
Author(s):
Counties with high liver transplantation registration rates and high liver-related mortality rates had comparable data on social vulnerability index, while travel distance was relatively shorter.
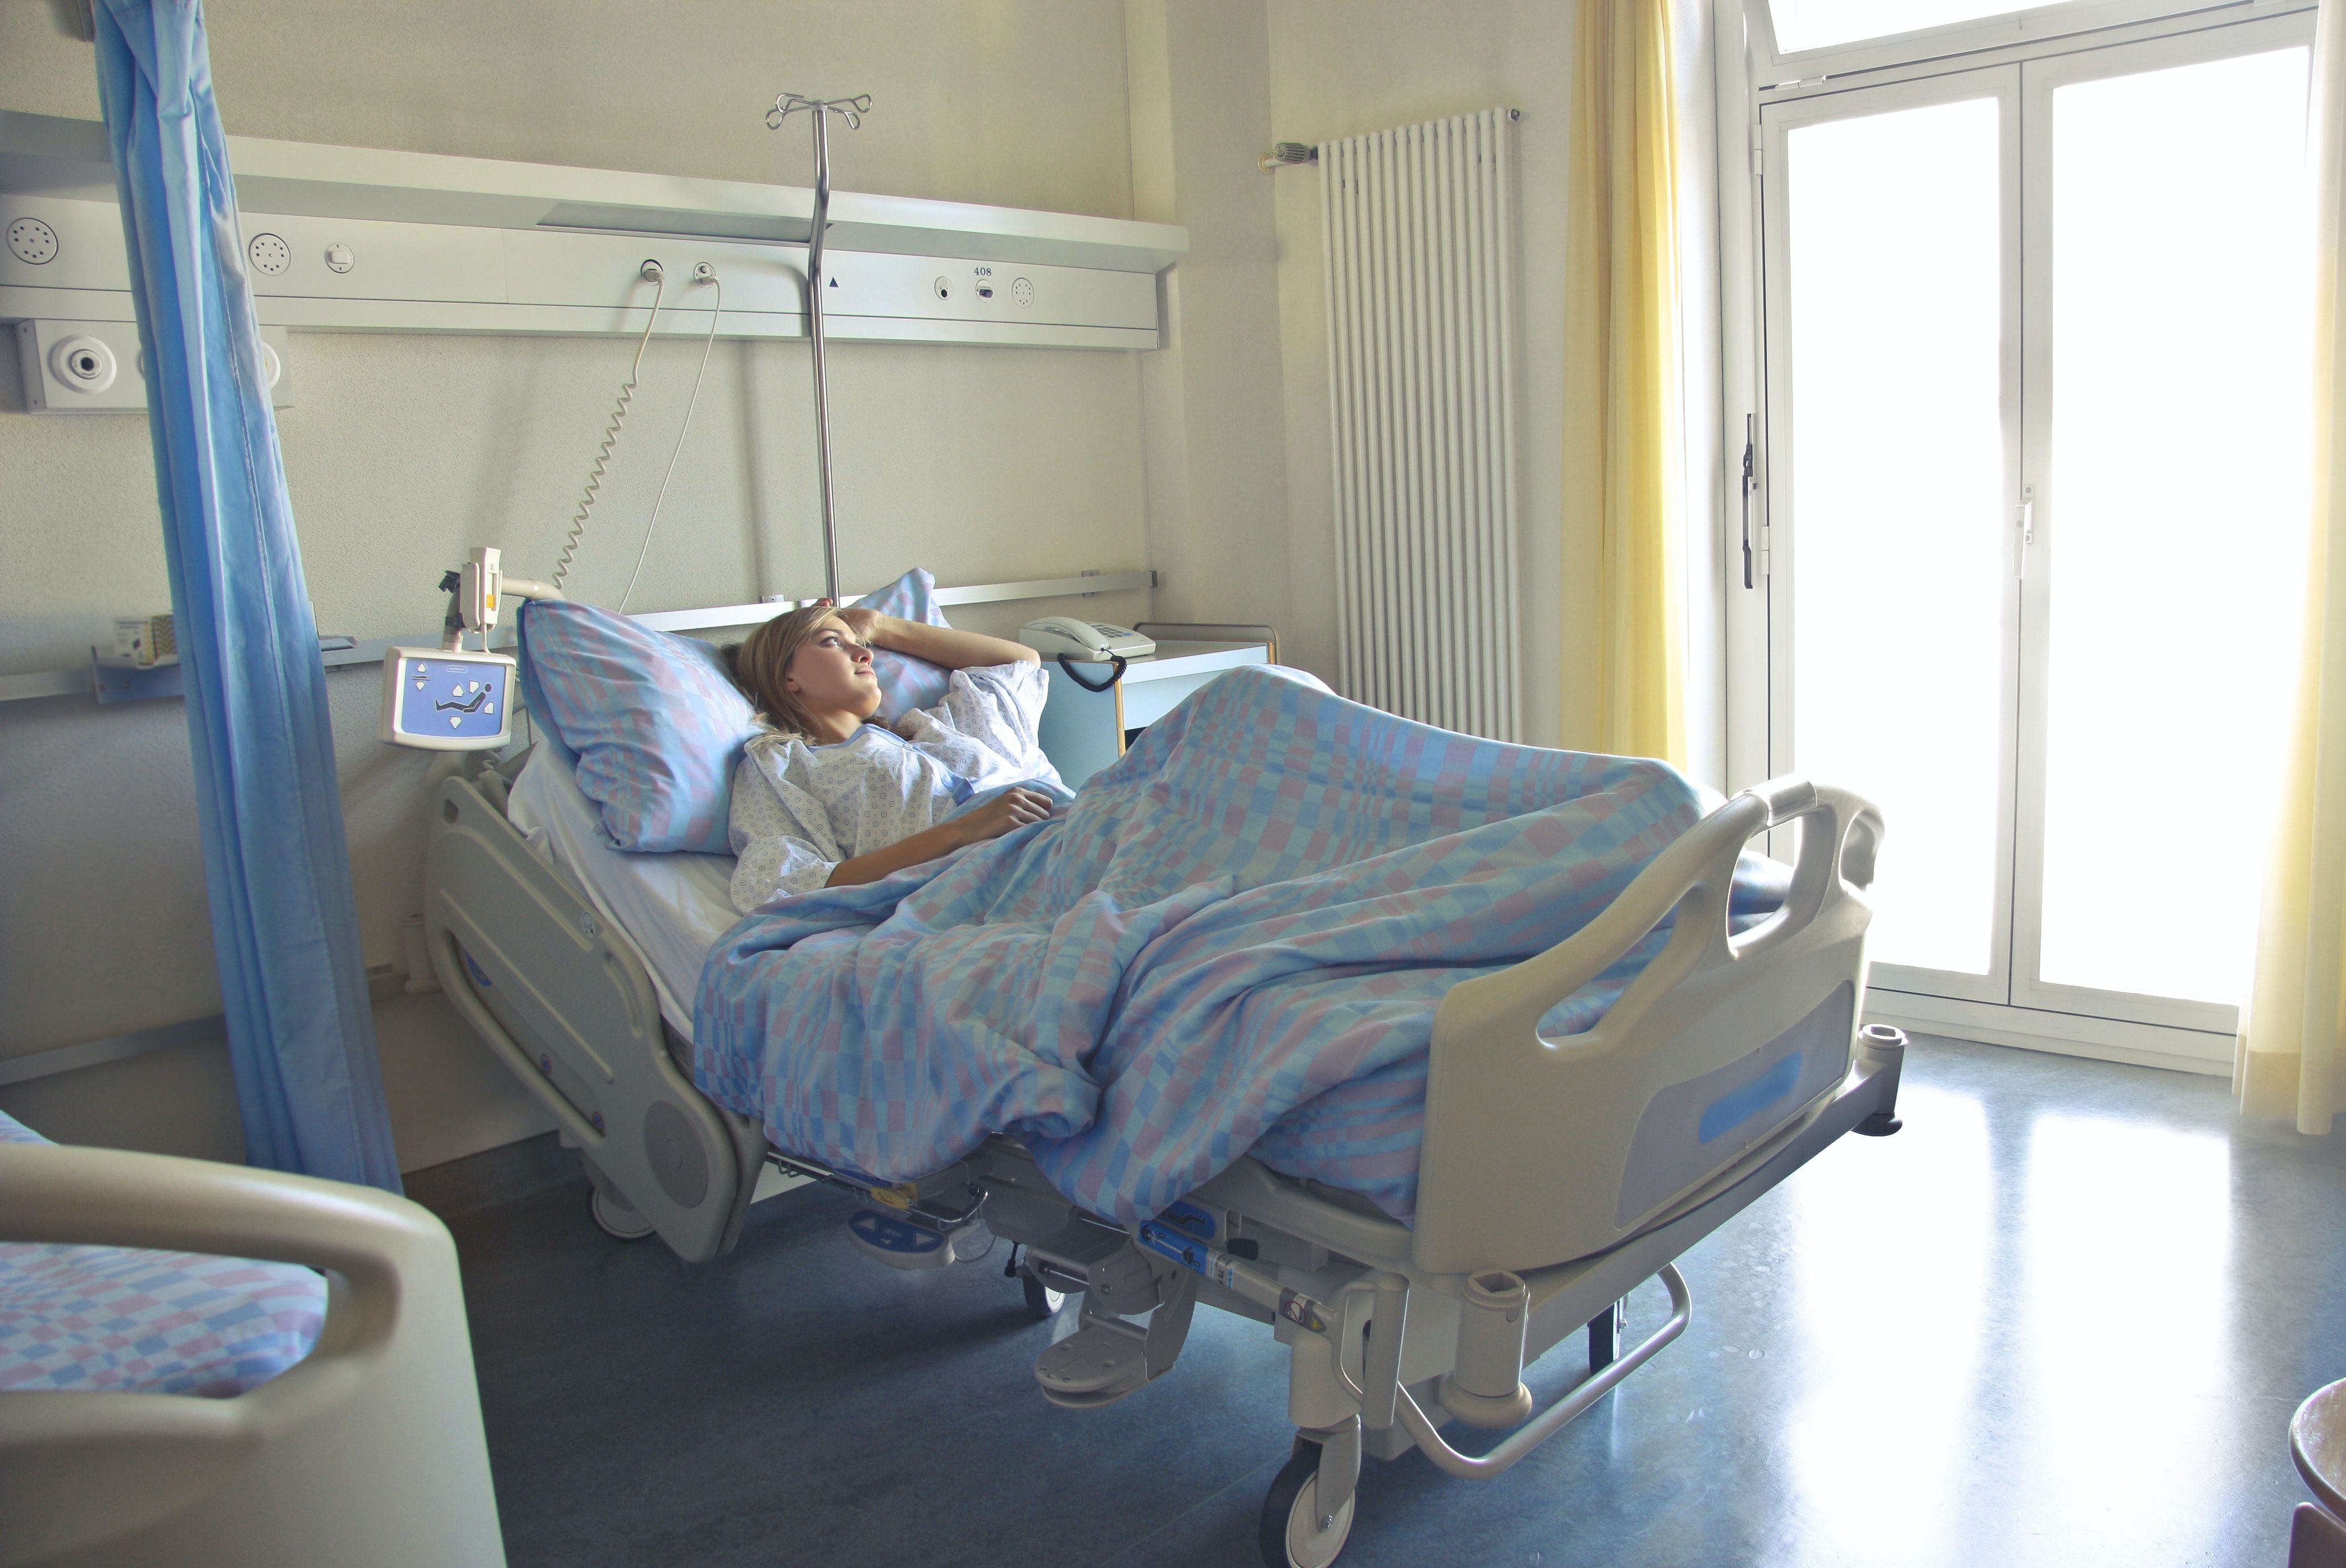
Credit: Andrea Piacquadio / Pexels

Areas with a longer distance to liver transplantation centers in the US feature higher liver-related mortality rates, according to new research.1
A team, led by Jason Yang, Department of Surgery, The Ohio State University Wexner Medical Center and James Comprehensive Cancer Center, identified the impact of travel distance to liver transplantation programs and social vulnerability on county differences in liver-related mortality.
Geographic Issues
There currently is not a good definition of geographic disparities in liver-related mortality across the US.
In the study, the investigators collected data on liver transplantation registrants from the Scientific Registry of Transplant Recipients Standard Analytic Files (SRTR SAFs) between 2004-2019 and liver-related mortality data from the US Centers for Disease Control and Prevention (CDC) Wide-ranging Online Data for Epidemiologic Research (CDC WONDER) program.
The team determined spatial epidemiological clustering of county-level liver transplantation registration and liver-related mortality rates using local Moran’s I and assessed social vulnerability index (SVI) and travel distance within various county clusters.
The Waitlist
Overall, the liver transplant waitlist included 151,864 registrants who were diagnosed with liver disease because of hepatitis C virus (HCV) or hepatitis B virus (HBV) (n = 68 479, 45.1), alcohol (n = 38 328, 25.2%), non-alcoholic steatohepatitis (NASH) (n = 17 485, 11.5%), liver tumors (n = 16 644, 11.0%), and other diseases (n = 10 928, 7.2%).
The median SVI was 59.3 and SVI (76.2 vs. 24.3, P <.001) was greater in the highest liver-related mortality quartiles, compared to the lowest.
The travel distances to liver transplantation centers was 143.1 miles in the lowest liver-transplantation quartiles, compared to 107.2 miles in the lowest quartiles (P <.001).
The results also show counties with lower registration rates and high liver-related mortality rates were linked to long travel distances and high SVI.
On the other hand, counties with high liver transplantation registration rates and high liver-related mortality rates had comparable data on SVI, while travel distance was relatively shorter.
“Counties with greater SVIs were associated with higher liver-related mortality, with the highest SVI counties having the highest overall liver-related mortality,” the authors wrote. “Longer travel distances were associated with higher liver-related mortality. These findings highlight the impact of social determinants of health (SDOH) on liver disease outcomes.”
Survival Rates
Research shows the survival rate of patients with HCV is lower following liver transplantation.2
In 2021, a team, led by Masatoshi Ishigami, Department of Gastroenterology and Hepatology, Nagoya University School of Medicine, reviewed why there is often a poor prognosis following liver transplantation for patients with hepatitis C virus, whose main causes of death were generally due to recurrent disease.
The overall survival of patients with hepatitis C virus infections was 82.2% at year 1, 75.2% at year 5, and 50.8% at year 10 following the transplant (P = .001).
The overall survival rates were lower comparatively to the group of patients with HCV. For this group, the survival rate was 94.5%, 87%, and 87% at years 1, 5, and 10 respectively.
In addition, 14 patients in HCV group died following the liver transplant with 3 of the deaths caused by hepatocellular carcinoma recurrence.
On the other hand, only 1 patient died from an HCV-related complication—fibrosing cholestatic hepatitis. The remaining 10 patients died from other reason outside of HCV disease progression.
Survival varied significantly based on the reason for transplant (P = .017), with survival significantly lower in HCV-positive patients compared to patients with hepatitis B virus (P = .037), primary biliary cholangitis (P = .026), and primary sclerosing cholangitis (P = .026).
2 Commerce Drive
Cranbury, NJ 08512
All rights reserved.


