Article
5 Domains of Social Determinants of Health Associated with Vision Loss
Author(s):
An analysis of 3 nationally representative data sets found that SDOH across domains of economic stability, educational attainment, health care access and quality, neighborhood and built environment, and social context were significant predictors of poor vision.
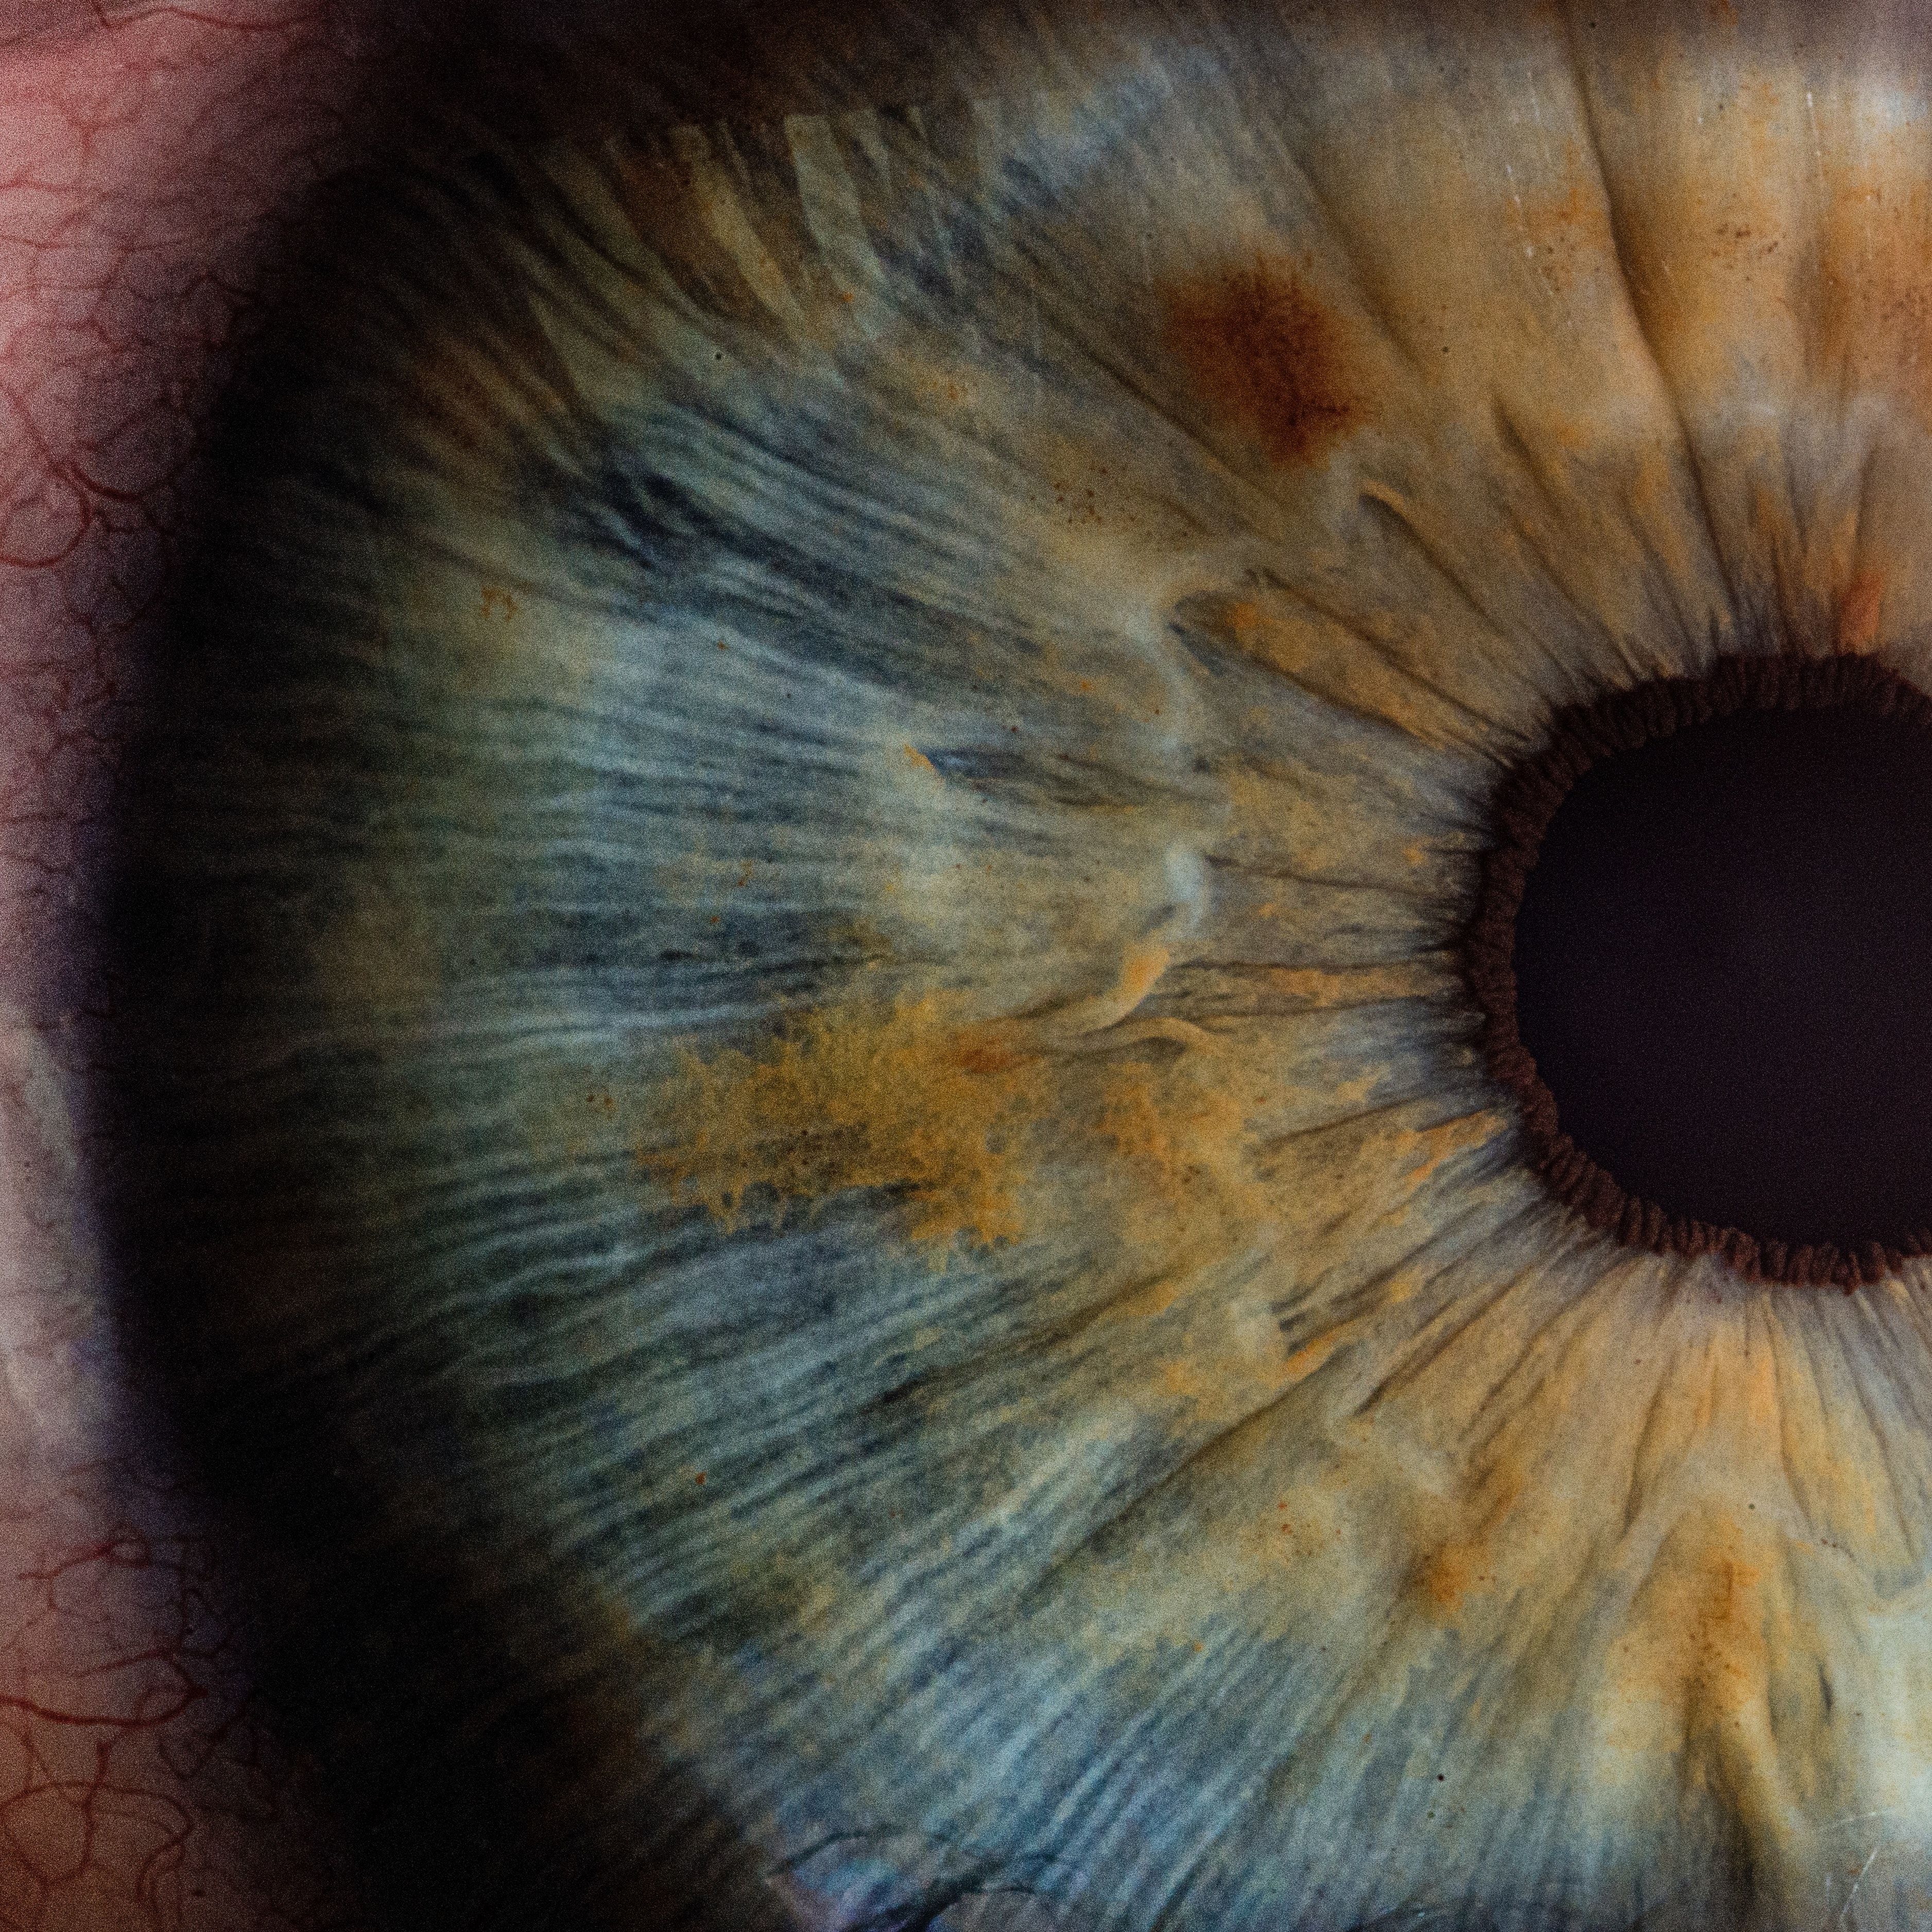
Credit: v2osk/Unsplash

New research indicates an association between social determinants of health (SDOH) and vision impairment, with the direction of the association consistent whether vision loss was examination-based or self-reported.1
The data showed strong evidence in 3 nationally representative surveys, with the investigative team from NORC at the University of Chicago suggesting that using self-reported vision data can be used as a surrogate measurement to monitor SDOH and vision both locally and over time.
“We found that 5 domains of SDOH were significantly associated with vision loss,” investigators wrote. “These findings support the use of self-reported vision data in a surveillance system to assess trends in SDOH and vision health outcomes at subnational geographies and over time.”
Led by Katelin M. Alfaro Hudak, PhD, the investigative team estimated associations between SDOH and examination-based visual acuity loss using data from the National Health and Nutrition Examination Survey (NHANES). The associations were further tested for self-reported vision loss using 2 data sources: Behavioral Risk Factor Surveillance System (BRFSS) and American Community Survey (ACS).
The population-based cross-sectional comparison included participants 12 years and older in the 2005 to 2008 NHANES, adults aged 18 years and older in the 2019 BRFSS, and participants of all ages (infants and older) in the 2019 ACS. Based on Healthy People 2030 SDOH concepts, investigators examined 5 measures of SDOH: economic stability, education access, and quality, health care access and quality, neighborhood and built environment, and social and community context. The primary outcomes for the analysis consisted of presenting visual acuity loss of 20/40 or worse in the better-seeing eye for NHANES data and self-reported blindness or serious difficulty seeing, even when wearing glasses, in both the ACS and BRFSS data.
Among a total of 3,649,085 included participants, 1,873,893 were female (51.1%) and 2,504,206 were White (64.4%). Data showed 10.3% of NHANES participants had presenting visual acuity of 20/40 or worse, while 5.2% of BRFSS participants and 2.4% of ACS respondents reported blindness or serious difficulty seeing.
Upon analysis, in adjusted logistic (NHANES) and generalized linear mixed (BRFSS and ACS) models, most SDOH were significant predictors of vision loss and effects were consistent across surveys. Higher-income was associated with lower odds of vision loss in all 3 surveys and those who were employed and those with higher levels of education had significantly lower odds of vision loss. Other variables including owning a home, having an urban residence, and having high-speed internet access were associated with lower odds of vision loss.
The investigative team examined several measures of healthcare access and quality. Individuals with a primary care physician had lower odds of vision loss in BRFSS, while in the ACS, those with Medicare, Medicaid, other government insurance, or no insurance had 22% to 155% higher odds of vision problems compared to those with private insurance.
Sociodemographic factors revealed Black, Hispanic, and other race/multiracial participants had higher odds of vision loss than White individuals in NHANES and BRFSS, while those with diabetes had higher odds of vision loss. Data indicated the state of residence explained 5.3% and 3.8% of the variation in vision loss in BRFSS and ACS, respectively, while public use microdata areas (PUMAs) explained 19.9% of the variation in ACS.
In sensitivity analyses using NHANES, among individuals categorized as having presenting visual acuity of 20/40 or worse, 82.6% were able to obtain 20/30 or better as their BCVA. Many of the associations observed between SDOH and presenting vision disappeared in fully adjusted models, including owning a home and poverty to income ratio (PIR), according to the analysis.
“This is intuitive because many of the significant determinants (eg, PIR, owning a home) are associated with income and access to resources,” investigators wrote. “Given enough resources, people who have the means to do so tend to seek eye care and proper refractive equipment.”
Hudak and colleagues indicated that self-reported data are more frequently collected, particularly among larger sample sizes, supporting their use for tracking geographic differences and changes over time.
“We found that associations between SDOH and vision loss track together when using either examination-based vision outcomes or self-reported measures, supporting the continued use of self-reported data to monitor and study SDOH and vision,” they wrote.
References
- Alfaro Hudak KM, Wittenborn JS, Lamuda PA, Lundeen EA, Saaddine J, Rein DB. Association Between Social Determinants of Health and Examination-Based Vision Loss vs Self-reported Vision Measures. JAMA Ophthalmol. Published online April 06, 2023. doi:10.1001/jamaophthalmol.2023.0723
2 Commerce Drive
Cranbury, NJ 08512
All rights reserved.


